When debugging UpdraftPlus, you will sometimes be told to open the JavaScript Console or Developer Tools.
Here is a quick guide on how to access this console on the most common browsers
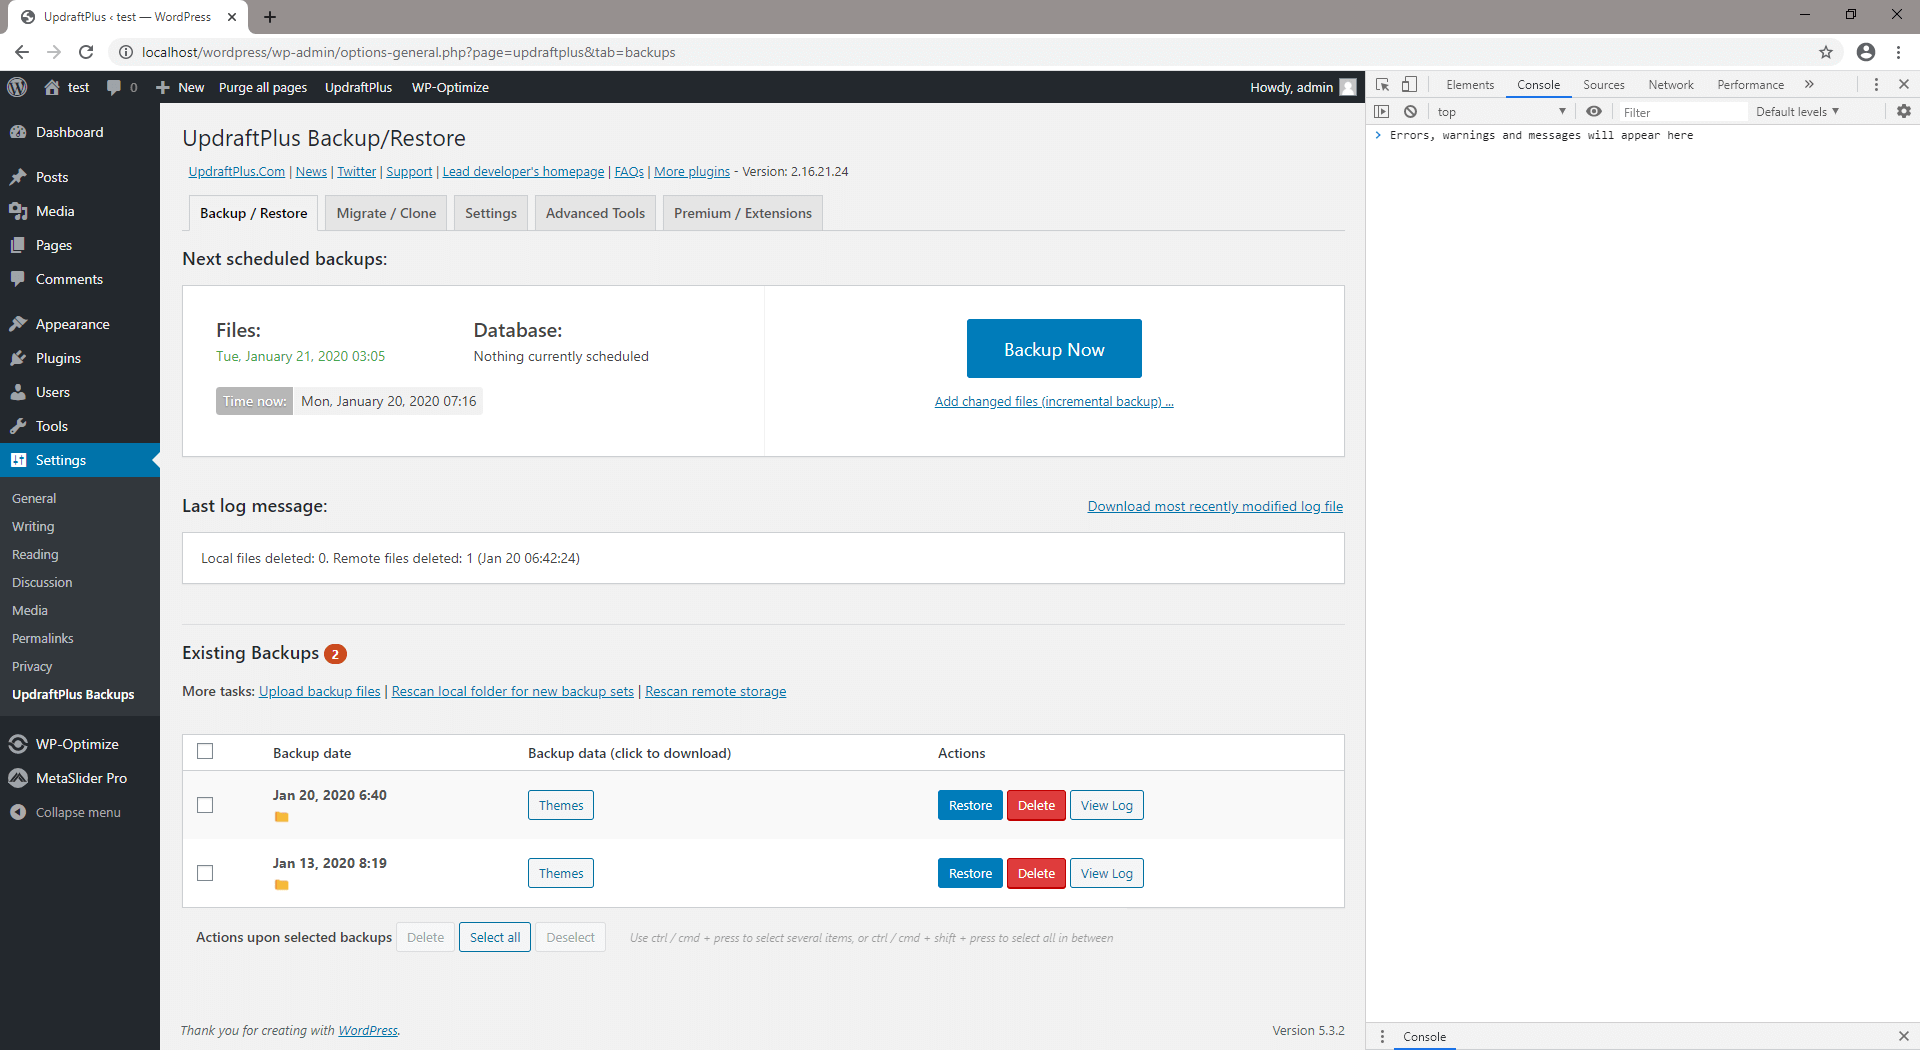
Google Chrome
- Navigate to the desired page
- Press CTRL+SHIFT+J (CMD+OPT+J on a Mac) or F12
- A Developer Tools sub-window should appear, as in the screenshot below
- In the Developer Tools window, click the ‘Console’ tab
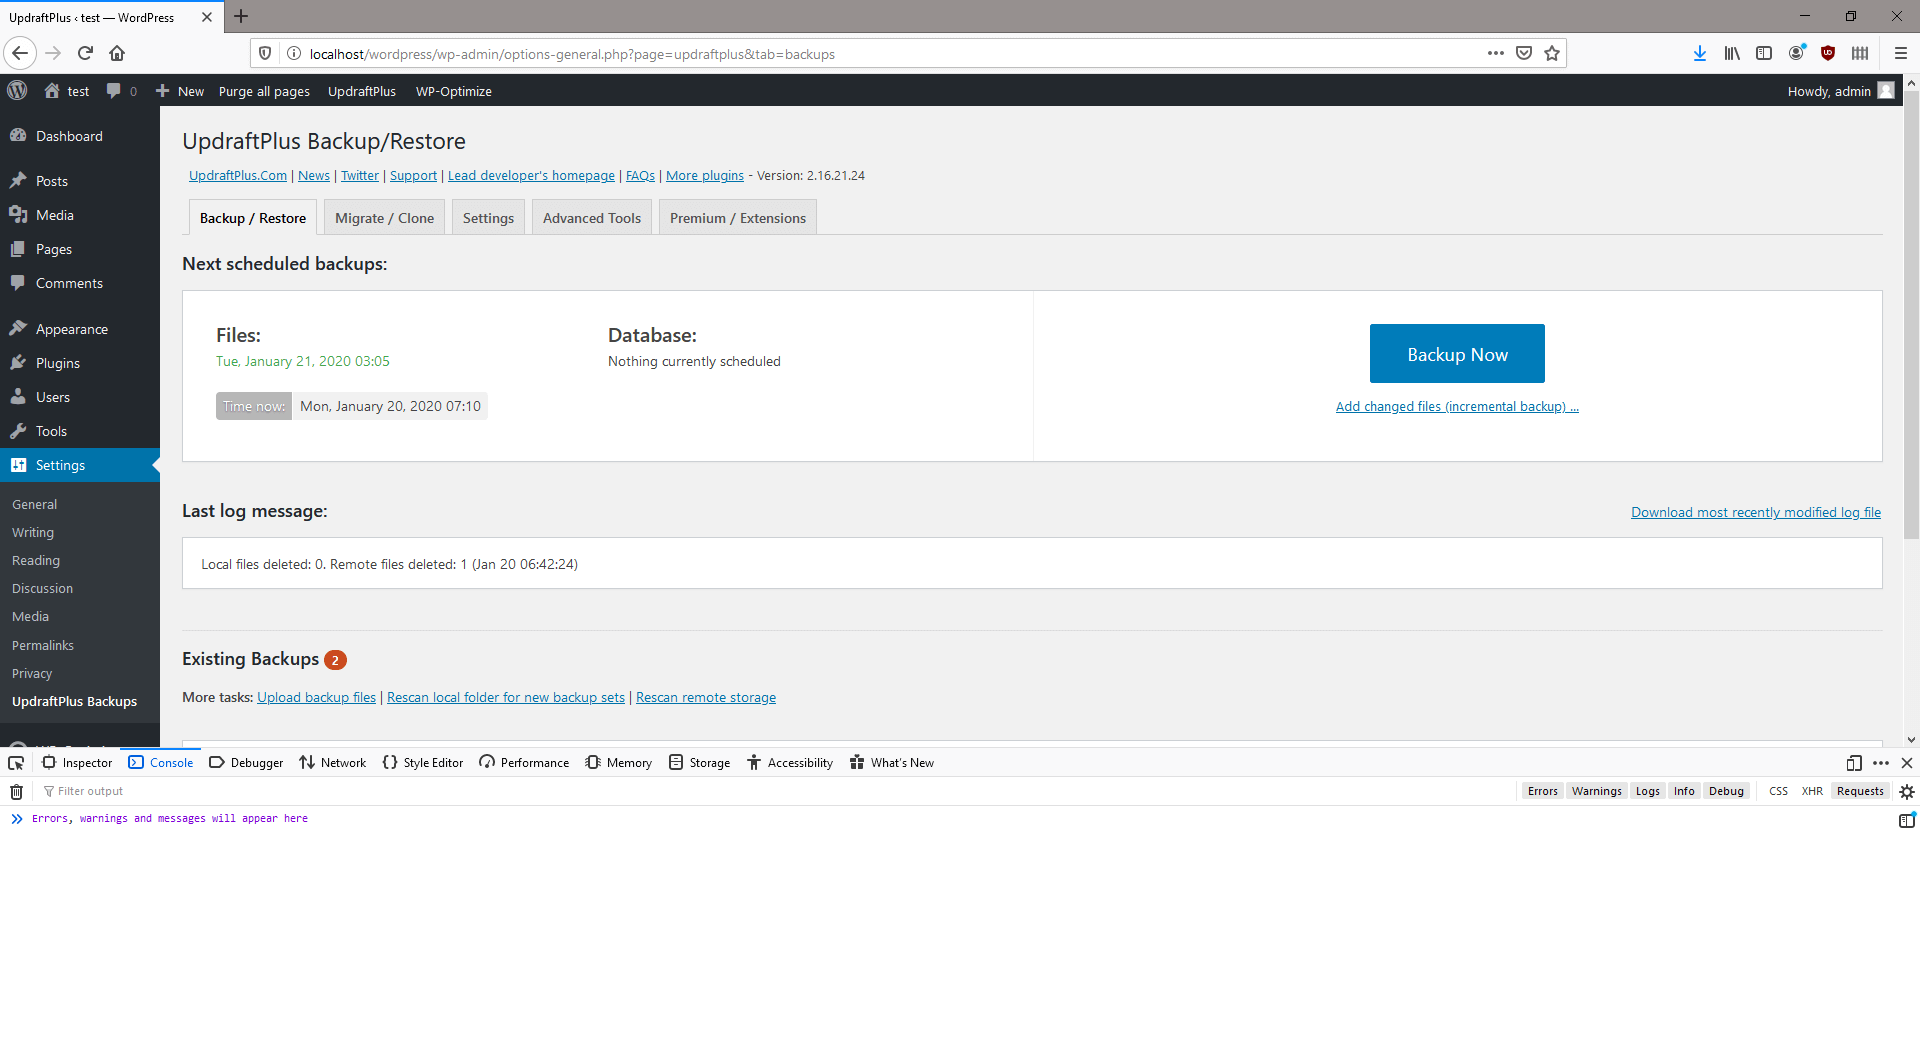
Mozilla Firefox
- Navigate to the desired page
- Press F12
- A Developer Tools sub-window should appear, as in the screenshot below
- In the Developer Tools window, click the ‘Console’ tab
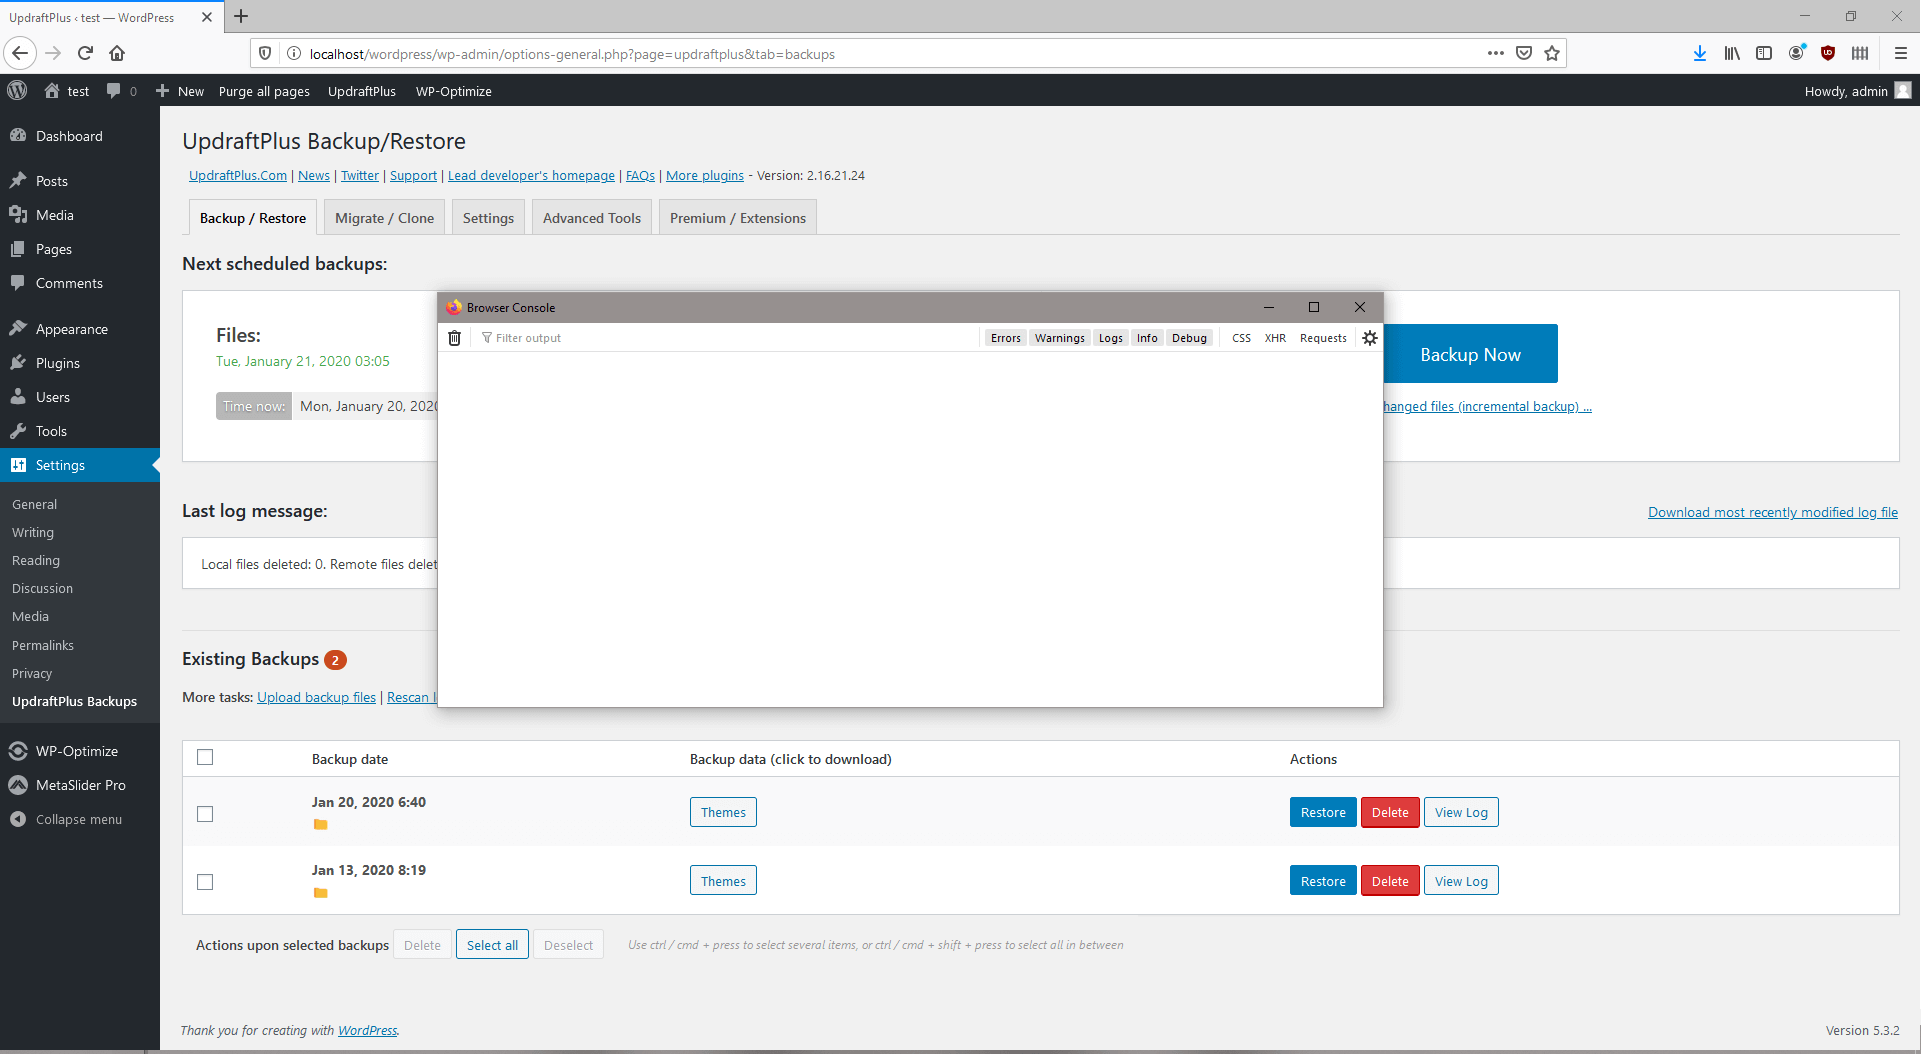
- Alternatively, press CTRL+SHIFT+J (CMD+OPT+J on a Mac) for a pop-out window containing the console
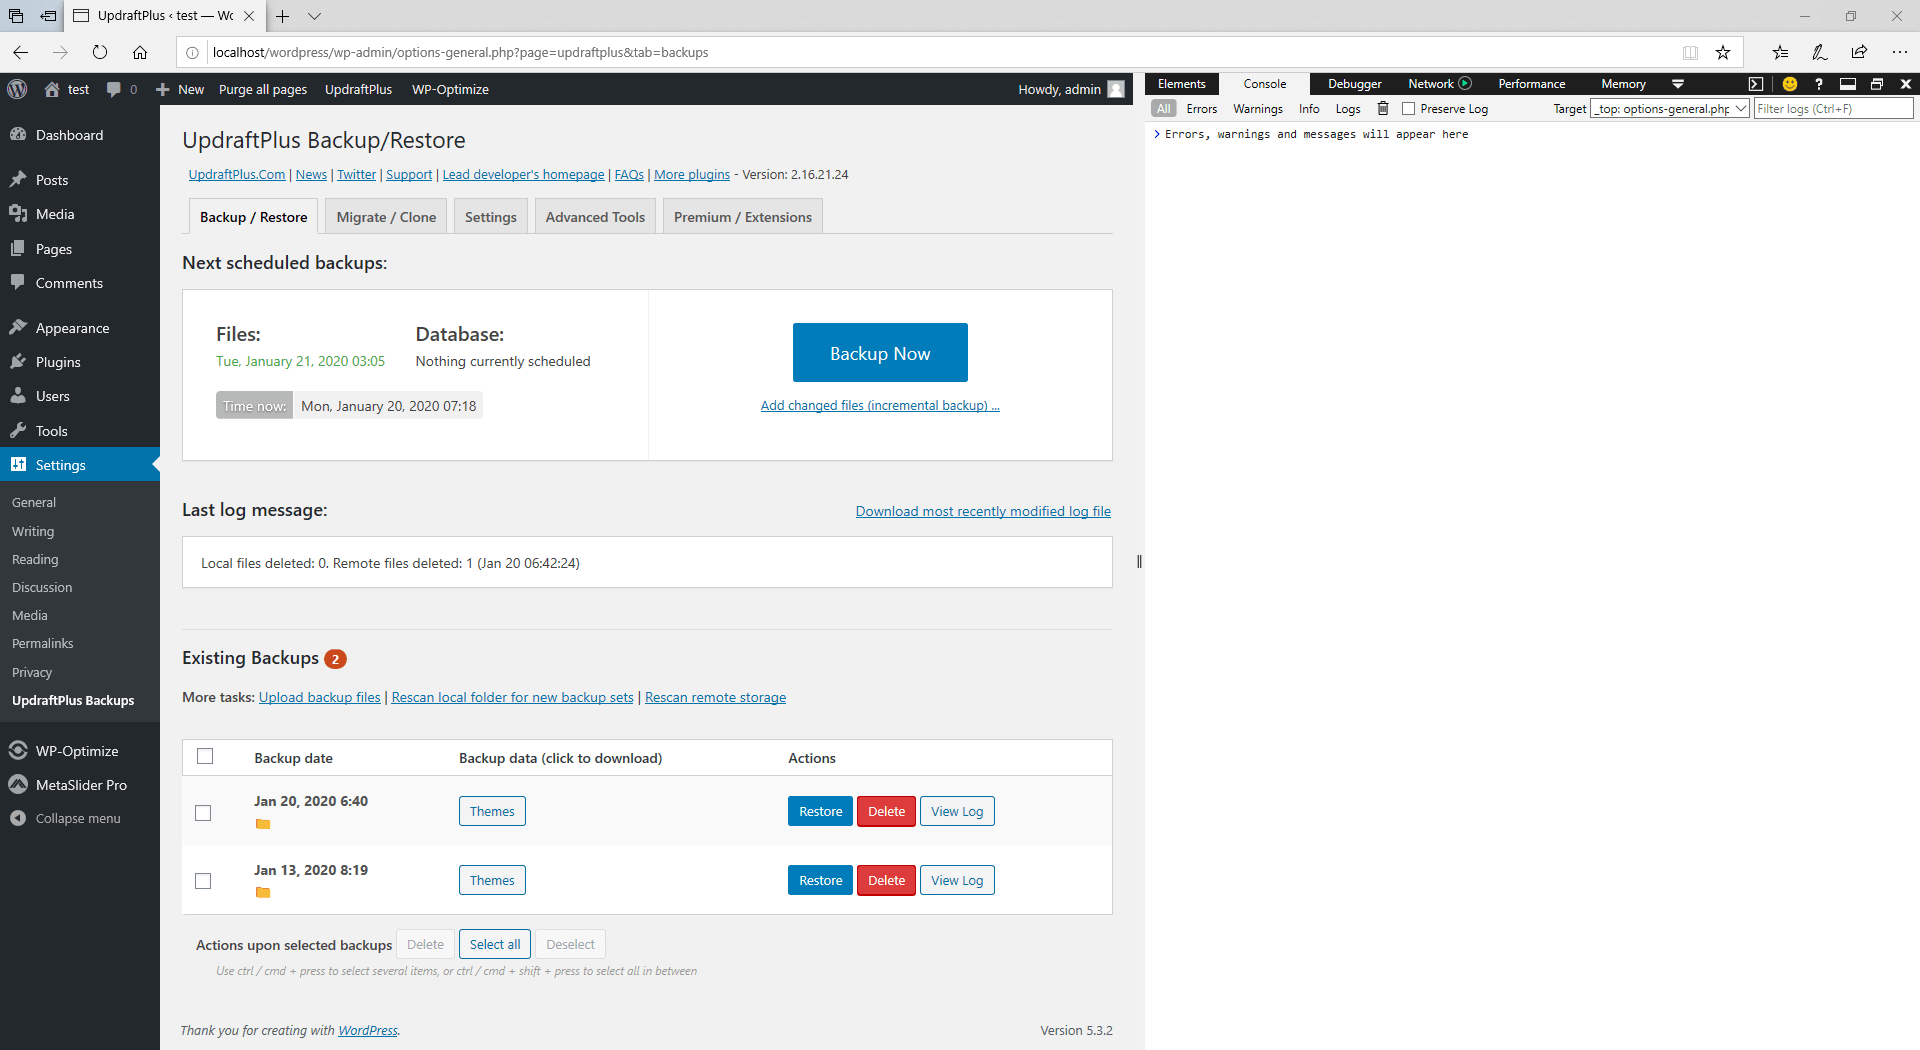
Internet Explorer / Edge
- Navigate to the desired page
- Press CTRL+SHIFT+J or F12
- A Developer Tools sub-window should appear, as in the screenshot below
- In the Developer Tools window, click the ‘Console’ tab
- Reload the current page
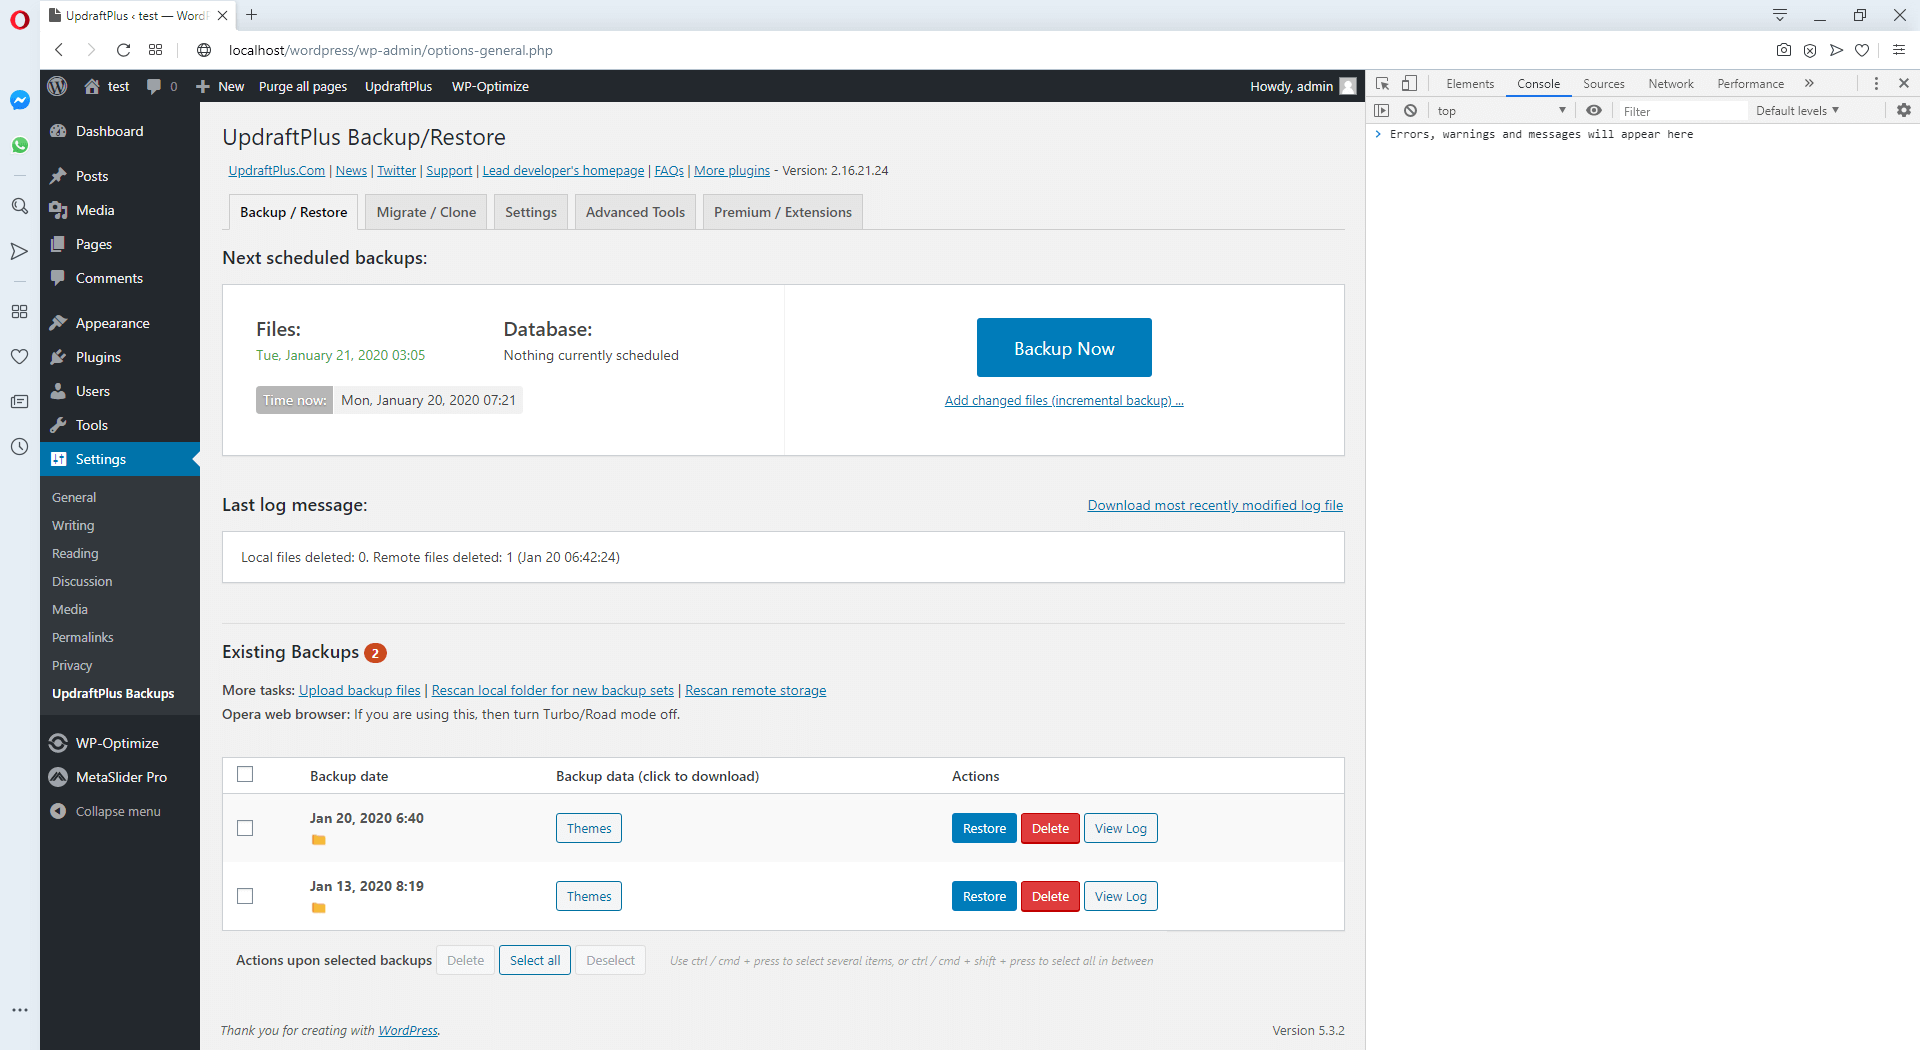
Opera
- Navigate to the desired page
- Press CTRL+SHIFT+J (Cmd+Opt+J on a Mac)
- A Developer Tools sub-window should appear, as in the screenshot below
- In the Developer Tools window, click the ‘Console’ tab
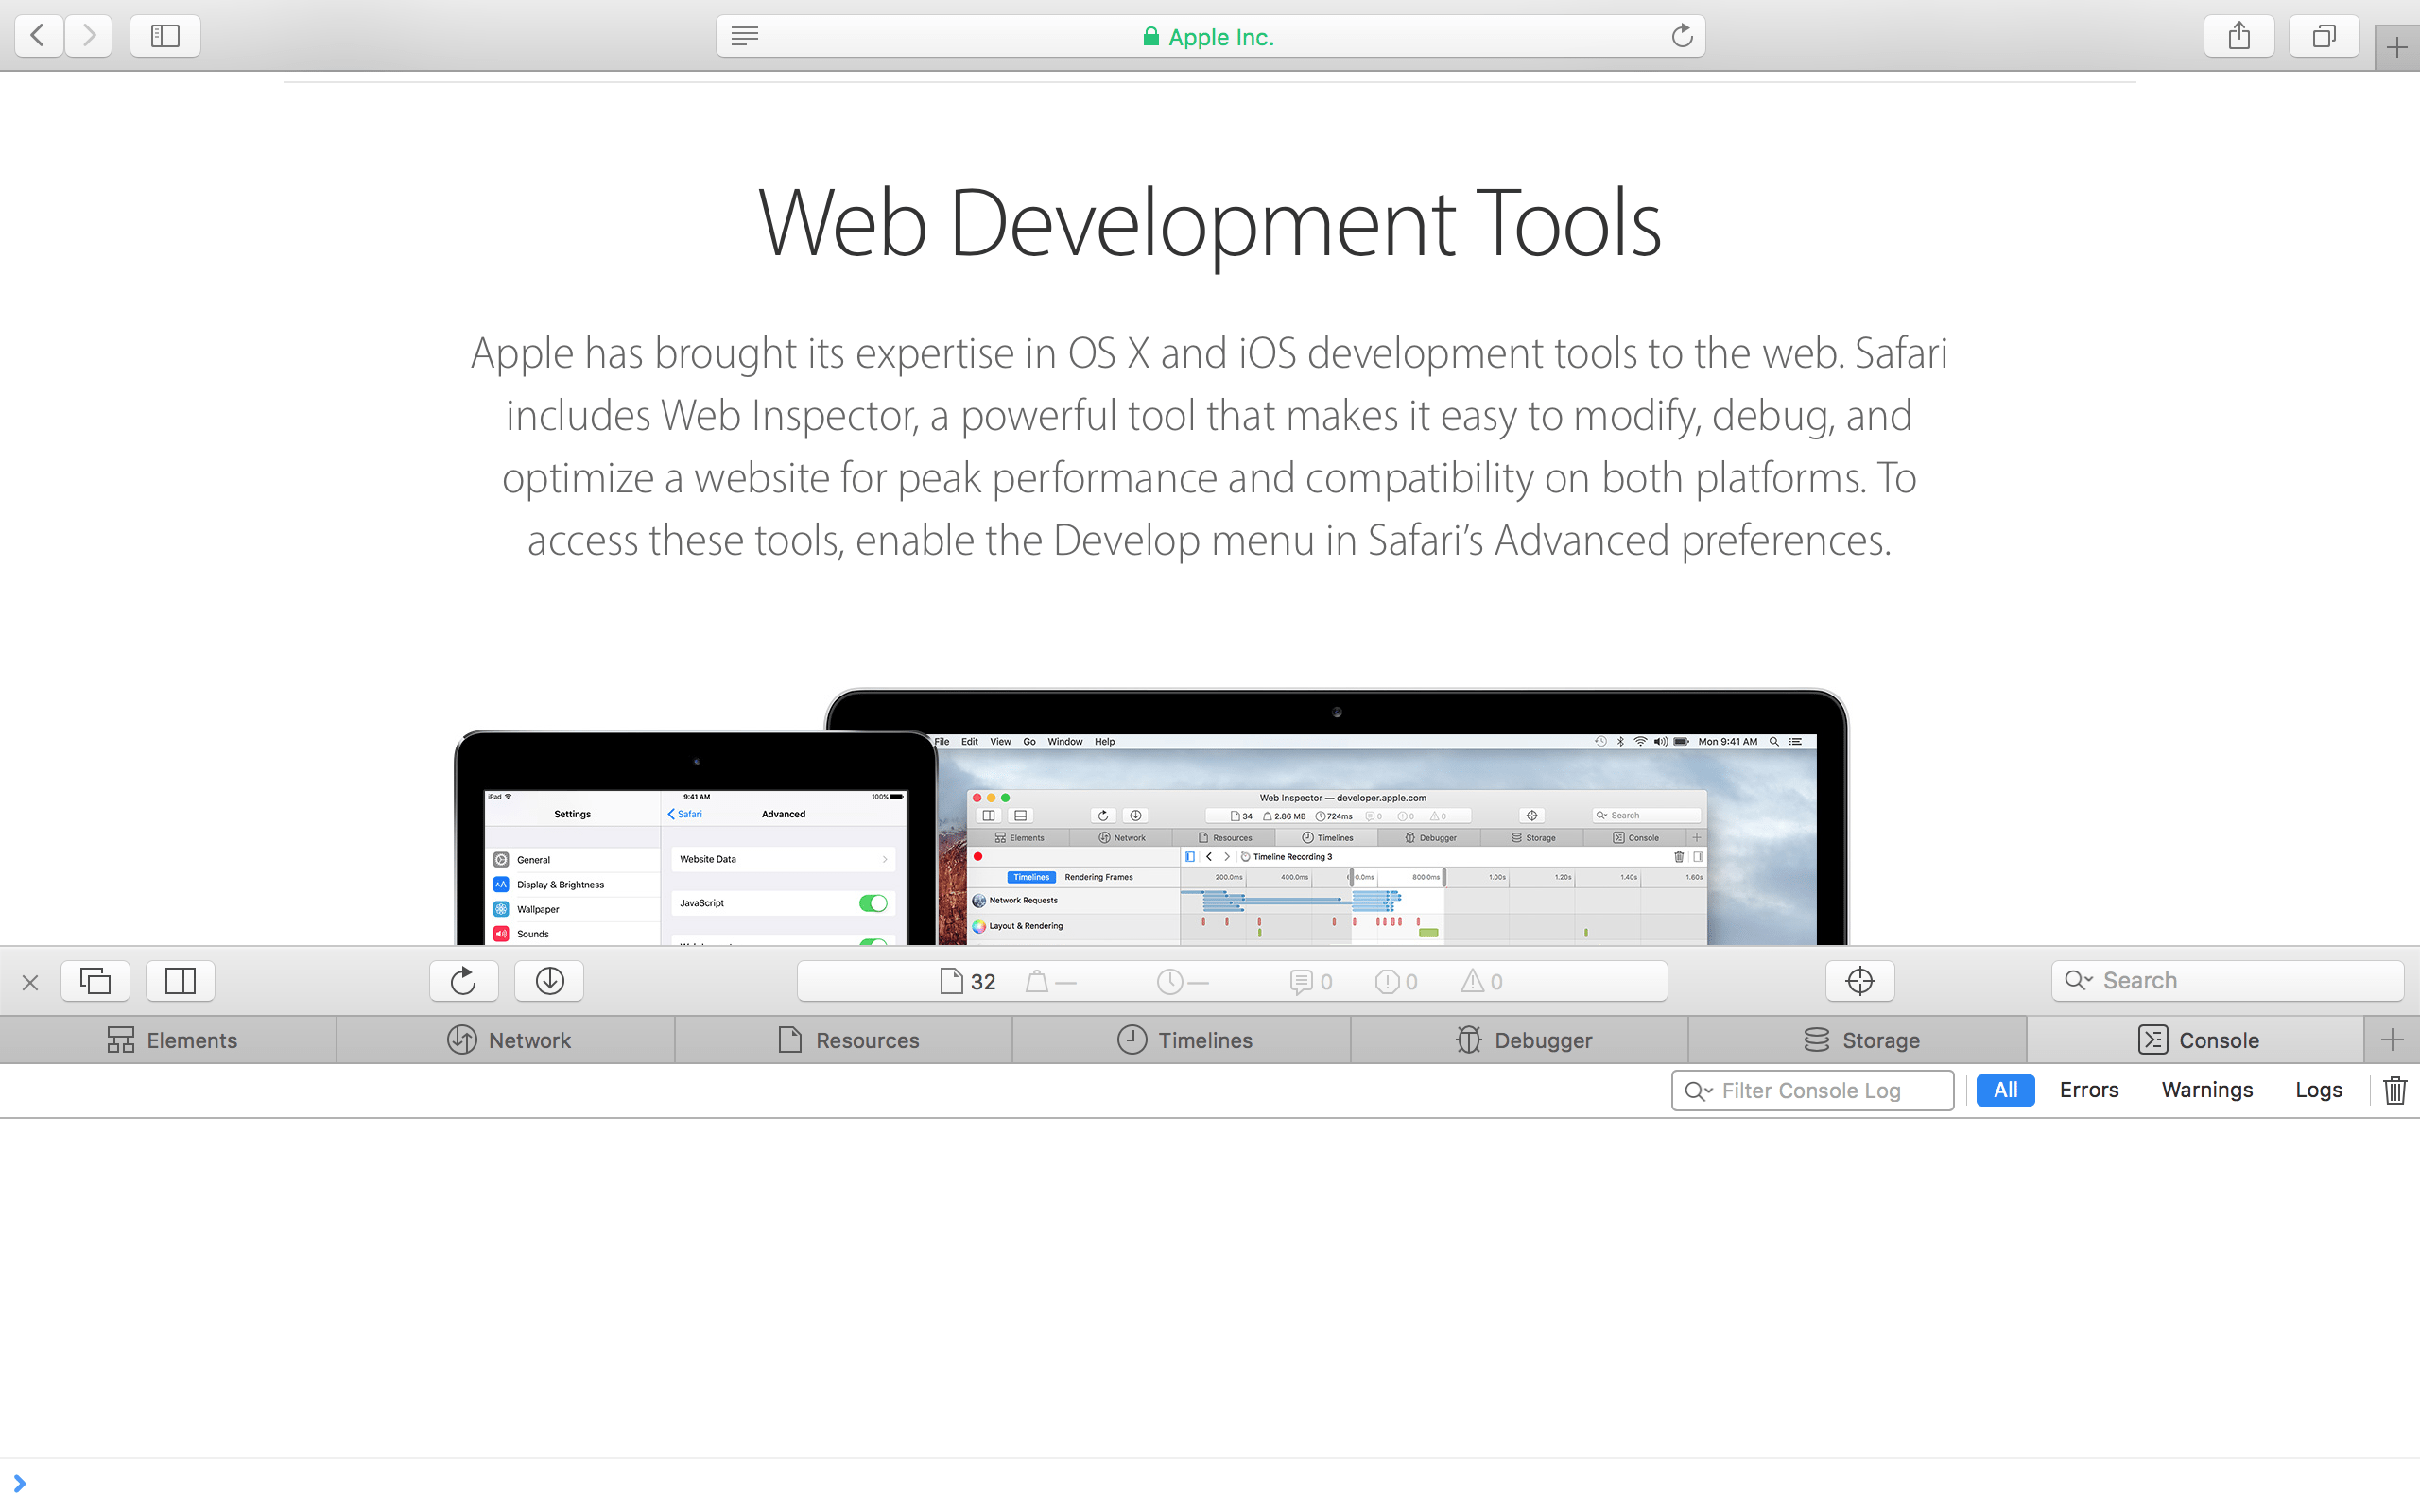
Safari
- Open Safari’s preferences, and open the Advanced pane
- Enable the ‘Show Develop menu in menu bar’ setting, and close the preferences pane
- Press CMD+OPT+C
- A Developer Tools window should appear, as in the screenshot below
- In the Developer Tools window, click the ‘Console’ tab
Posted in: Troubleshooting
![]()
![]()
![]()